

Confidence interval
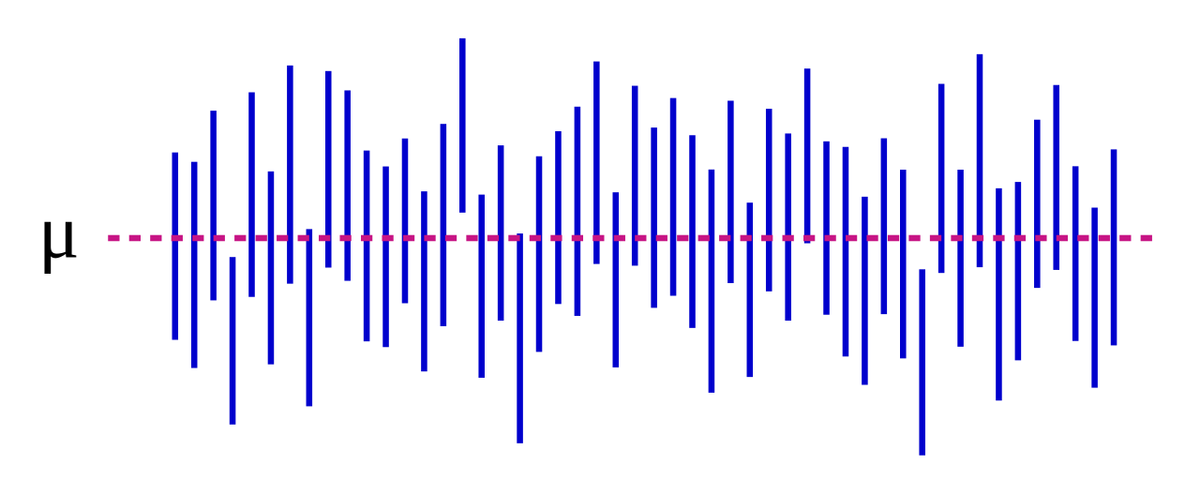
A confidence interval (CI) is a range of values, computed from sample data, that is produced by a procedure designed to contain the true value of an unknown parameter in a stated proportion of repeated samples. If 95 percent confidence intervals are calculated over and over in valid applications, about 95 percent of them will cover the true value; this long-run frequency is the interval's coverage probability, and it describes the procedure rather than any single interval.[1][2] Confidence intervals are a central tool of frequentist statistics, and they are closely tied to hypothesis testing: the values not rejected by a test at the 5 percent level typically form a 95 percent interval.[1] In machine learning, they are used to put error bars on benchmark scores, leaderboard ratings and other evaluation results that are estimated from a finite set of test items or training runs.[13][20][21]
Definition
Let $\theta$ be an unknown parameter, such as a population mean or a model's true accuracy, and let $X$ be the observed data. A $100(1-\alpha)$ percent confidence interval is a pair of statistics $L(X)$ and $U(X)$ chosen so that
for every possible value of $\theta$, at least approximately. The quantity $1-\alpha$ is called the confidence coefficient or confidence level, and $\alpha$ is the corresponding significance level.[2] Common choices are 90, 95 and 99 percent.[2] Exact methods such as the Clopper-Pearson interval for a proportion guarantee coverage of at least $1-\alpha$, though they tend to be conservative; most approximate methods aim for coverage close to $1-\alpha$ on average but can fall short in some cases.[5]
The probability statement refers to the random interval before the data are seen. Once a particular interval has been computed, it either contains the true value or it does not, so a computed 95 percent interval does not have a 95 percent probability of containing the parameter in the frequentist sense.[1][2]
Width
The width of an interval reflects how precisely the data pin down the parameter. For the standard interval for a mean, the width shrinks as the sample size grows (the sample size enters under a square root) and grows with the spread of the data.[2] Because the dependence is on $\sqrt{N}$, halving the width requires roughly four times as many observations. A higher confidence level uses a larger critical value from the reference distribution and so gives a wider interval for the same data.
Constructing confidence intervals
Intervals for a mean
The textbook interval for the mean of a roughly normally distributed quantity is
where $\bar{Y}$ is the sample mean, $s$ the sample standard deviation, $N$ the sample size and $t_{1-\alpha/2,,N-1}$ the corresponding percentile of Student's t distribution with $N-1$ degrees of freedom.[2] The term $s/\sqrt{N}$ is the standard error of the mean. For large samples, the t percentile is replaced by a normal quantile, which gives the familiar 95 percent interval of the estimate plus or minus 1.96 standard errors.[13]
Intervals for a proportion
Many quantities in statistics and machine learning are proportions: the fraction of questions a model answers correctly, a defect rate, a click-through rate. The simplest interval, often called the Wald or normal-approximation interval, is
where $\hat{p}$ is the observed proportion and $n$ the number of trials.[3] It is the most frequently used formula, but its lower limit can be negative, which is impossible for a proportion.[3] Lawrence D. Brown, T. Tony Cai and Anirban DasGupta showed in 2001 that the coverage of the Wald interval is erratic, that its problems persist far more widely than commonly appreciated, and that common textbook advice about when it is safe to use is misleading.[4]
Several alternatives are in common use:
| Method | Construction | Notes |
|---|---|---|
| Wald (normal approximation) | Estimate plus or minus z standard errors | Simple; erratic coverage; can leave [0, 1][3][4] |
| Wilson score | Inverts the large-sample test for a proportion | Stays inside [0, 1]; recommended by Brown, Cai and DasGupta for small n[3][4] |
| Agresti-Coull | Adjusted Wald interval | Recommended by Brown, Cai and DasGupta for larger n[4][5] |
| Jeffreys | Equal-tailed interval based on the Jeffreys prior | Recommended by Brown, Cai and DasGupta for small n[4][5] |
| Clopper-Pearson | Exact interval from binomial tail probabilities | Coverage at least $1-\alpha$, but generally conservative (wide)[3][5] |
The Wilson interval dates to a 1927 paper by Edwin B. Wilson, and the exact interval is named after C. J. Clopper and E. S. Pearson, whose 1934 paper in Biometrika illustrated confidence limits with the binomial case.[3][6][24] The US National Institute of Standards and Technology (NIST) notes that when the number of failures or the sample size is very small, normal-approximation limits may not be accurate enough for some applications, and gives the exact binomial interval for that case.[3] The statsmodels library implements all of these through its proportion_confint function, whose default method is the normal approximation; its documentation notes that the Clopper-Pearson interval is generally conservative and that most other methods can undercover in some cases.[5]
Bootstrap intervals
Many statistics have no convenient formula for their sampling distribution: medians, ratios, corpus-level metrics such as BLEU, or ratings fitted by a model. Bradley Efron introduced the bootstrap in 1979 as a general method for estimating the sampling distribution of a statistic from the observed data alone, by resampling the data with replacement.[7] Confidence intervals can then be read from the distribution of the statistic over many resamples.
The SciPy function scipy.stats.bootstrap illustrates the common variants. The percentile method takes the central portion of the bootstrap distribution that contains the requested confidence level; the basic (or "reverse percentile") method and the bias-corrected and accelerated (BCa) method differ only in how that interval is determined. SciPy's defaults are the BCa method, 9,999 resamples and a 95 percent confidence level, and its documentation describes the plain percentile method as intuitive but rarely used in practice.[8]
Relationship to hypothesis tests
Confidence intervals and significance tests are two views of the same calculation. If a test is run for every candidate value of the parameter, the values whose test gives a p-value above 0.05 typically form a 95 percent confidence interval, provided the statistical model is correct.[1] An interval that excludes zero for a difference between two groups therefore corresponds to a difference that is significant at the matching level. NIST derives the Wilson interval in exactly this way, by inverting the hypothesis test for a proportion.[3]
History
The calculation behind a modern confidence interval is older than the name. The statistician Glenn Shafer notes that Joseph Fourier's 1826 memoir called it "a 19 out of 20 bet" that an error would not exceed a stated bound, which corresponds to the familiar 95 percent interval of 1.96 standard errors, and that Antoine Augustin Cournot defined what is now called a confidence interval in his 1843 book on probability while explicitly rejecting Laplace's Bayesian interpretation.[9]
The modern theory and terminology come from Jerzy Neyman. According to Shafer, Neyman introduced the English terms "confidence coefficient" and "confidence interval" in a 1934 paper on survey sampling in the Journal of the Royal Statistical Society, and later explained (in a 1941 paper) that he had used such intervals in Poland since 1930 under the Polish name przedzial ufnosci.[9] Ronald Fisher had published intervals for parameters obtained without prior probabilities from 1930 onward, which he called fiducial intervals; Neyman at first presented his own definition as a clarification of Fisher's work, but Fisher was unhappy with this, and Neyman was pushed to present his theory as different from Fisher's.[9] Neyman's full treatment appeared in 1937 as "Outline of a Theory of Statistical Estimation Based on the Classical Theory of Probability" in the Philosophical Transactions of the Royal Society.[9][10] In it he observed that statistical publications rarely reported an estimate without an accompanying plus-or-minus term (its standard error $S_T$), and argued that statisticians in practice had in mind not a single estimate but a lower and an upper limit, set by constant multiples of $S_T$, between which the true value of the parameter presumably falls.[9]
Interpretation and misinterpretation
Confidence intervals are widely misread. A 2016 guide by Sander Greenland, Stephen Senn, Kenneth Rothman, John Carlin, Charles Poole, Steven Goodman and Douglas Altman lists common misinterpretations of statistical tests, confidence intervals and power, including these about intervals:[1]
| Common claim | Why it is wrong |
|---|---|
| A specific 95% interval has a 95% chance of containing the true value | Coverage is a property of the procedure over many repetitions; a given interval either contains the value or does not |
| A value outside the 95% interval has been refuted by the data | The interval depends on model assumptions that may be violated |
| If two intervals overlap, the difference between the estimates is not significant | Intervals can overlap substantially while the test of the difference gives P < 0.05 |
| 95% of future estimates will fall inside the observed interval | The chance is usually well below 95%; in the guide's example of two independent studies it is 83% |
| The interval that excludes the null is the more precise one | Precision is measured by width, not by whether the null value is excluded |
In the overlap example, intervals of (1.04, 4.96) and (4.16, 19.84) overlap, yet the test for a difference between the two estimates gives P = 0.03. Non-overlapping intervals do imply a significant difference, but the reverse does not hold.[1] The practical consequence for comparisons, including comparisons of machine learning models, is that the uncertainty of a difference should be computed directly rather than judged by eye from two separate error bars.
The misreadings are common even among professionals. In a study published in 2014, Rink Hoekstra, Richard Morey, Jeffrey Rouder and Eric-Jan Wagenmakers asked 120 psychology researchers and 442 psychology students to judge six statements about a confidence interval. All six statements were false, yet both groups endorsed more than three on average, and researchers' self-reported statistical experience did not predict their performance.[11]
Some statisticians go further and question whether confidence interval theory supports the uses researchers put intervals to. Morey and colleagues argued in 2016 that intervals do not necessarily index the precision of an estimate or the plausibility of values within them, and that the confidence level need not indicate how plausible it is that the true value lies inside. They cautioned against relying on confidence interval theory to justify interval estimates and suggested using other theories of interval estimation instead.[12] One alternative is the Bayesian credible interval, which has a 95 percent posterior probability of containing the parameter; confidence intervals are commonly misread as if they were credible intervals.[18] (See Bayesian inference.)
Use in machine learning evaluation
Why benchmark scores need intervals
A benchmark score is an estimate. The test questions are a finite sample from a larger space of possible questions, and the model's own outputs may vary from run to run, so the same model would score differently on a different draw of questions or a different random seed. The Llama 3 technical report states the point directly: benchmark scores are estimates that "have variance because benchmark sets are finite samples drawn from some underlying distribution."[15]
Research on evaluation practice has repeatedly found this uncertainty ignored. A 2024 study by Lovish Madaan and colleagues measured several kinds of benchmark variance, including variance across training seeds, and noted that such variance, which decides whether differences between models are meaningful, is rarely quantified.[16] Xavier Bouthillier and co-authors found in 2021 that data sampling, parameter initialization and hyperparameter choice all have a marked effect on benchmark results, and analysed how comparison methods in common use cope with that variance.[17]
Standard errors for evaluation scores
In November 2024 Evan Miller of Anthropic published "Adding Error Bars to Evals", which treats language model evaluations as experiments whose questions are drawn from an unseen super-population.[13][14] For a score averaged over $n$ questions, the standard error of the mean is
which reduces to $\sqrt{\bar{s}(1-\bar{s})/n}$ for right-or-wrong scoring, and a 95 percent interval is the mean plus or minus 1.96 standard errors.[13][14] For example, a model that scores 80 percent on 1,000 independent questions has a standard error of about 1.3 percentage points, giving a 95 percent interval of roughly 77.5 to 82.5 percent. The paper's recommendations are:[13]
| Recommendation | Reason given |
|---|---|
| Compute standard errors using the central limit theorem | Applies to any eval with finite-variance scores and many questions; the bootstrap is unnecessary unless the sampling scheme or estimator is complicated |
| Cluster standard errors when questions come in related groups | Questions sharing a passage (as in DROP, SQuAD and RACE) or translated from one source (as in MGSM) are not independent; on DROP the clustered standard error was about three times the naive one |
| Reduce variance within questions | Resample answers several times for chain-of-thought evals; use next-token probabilities when there is no chain of thought |
| Compare models on question-level paired differences | Models tend to agree on which questions are easy or hard, so pairing reduces the variance of the comparison at no extra cost |
| Use power analysis | In the paper's worked example, detecting a 3-point difference with 80 percent power at the 5 percent level needs about 969 questions; it suggests new evals contain at least 1,000 questions |
The paper also advises against lowering the sampling temperature to reduce variance, and notes that error bars "remain noticeably absent" from traditional question-and-answer evals, citing the Llama 3 report as a notable exception.[13] That report computed its 95 percent intervals as $1.96\sqrt{S(1-S)/N}$, where $S$ is the observed score and $N$ the benchmark size, while acknowledging that the Gaussian assumption is incorrect for bounded scores and that preliminary bootstrap experiments suggested it is a good approximation for discrete metrics.[15]
Small benchmarks
The normal approximation behind these formulas works poorly on small benchmarks. In a position paper presented as a spotlight at ICML 2025, Sam Bowyer, Laurence Aitchison and Desi Ivanova argued that intervals based on the central limit theorem are appropriate for benchmarks with thousands of examples but usually understate uncertainty, producing error bars that are too small, on the smaller and more specialized benchmarks that are increasingly common.[18] When a model gets every question right or every question wrong, the standard error is zero and the interval collapses to a point. In their simulations the Wilson score interval and simple Bayesian intervals based on a Beta-Bernoulli model achieved close to nominal coverage at small sample sizes, while the exact Clopper-Pearson interval was overly conservative; they recommended the Wilson or Bayesian intervals in practice.[18]
Bootstrap intervals in NLP
Bootstrap intervals are common for metrics that are not simple averages. Philipp Koehn's 2004 paper on significance tests for machine translation evaluation used bootstrap resampling to compute confidence intervals for BLEU, since BLEU is not the mean of sentence-level scores and has no simple analytic interval. Test sets of 300 sentences were resampled with replacement 1,000 times, and the 25 highest and 25 lowest scores were dropped to leave a 95 percent interval. Checked against a score computed on 30,000 sentences, the intervals from 100 test sets covered that near-true score in all but three cases.[19]
Leaderboards
Pairwise-preference leaderboards also report intervals. The 2024 paper describing Chatbot Arena fits Bradley-Terry coefficients to crowdsourced votes and considers two ways to put intervals on them: the pivot bootstrap and "sandwich" robust standard errors. The authors chose to deploy the sandwich intervals because they are smaller in large samples.[20] Because a ranking compares every model at once, the paper also builds simultaneous intervals with a multiplicity correction, and it assigns each model a rank of one plus the number of models whose lower bound lies above its upper bound, so that a model is ranked below another only when their intervals separate.[20]
Reinforcement learning
In deep reinforcement learning, training runs are expensive, and results are often reported from only a few runs per task. Rishabh Agarwal and colleagues showed in 2021, using the Atari 100k benchmark as a case study, that conclusions drawn from point estimates of aggregate performance can differ substantially from those of a fuller statistical analysis, and argued for reporting interval estimates. The paper received an Outstanding Paper Award at NeurIPS 2021.[21] Its accompanying open-source library, rliable, computes stratified bootstrap confidence intervals and promotes the interquartile mean, the average over the middle 50 percent of runs, as an aggregate that is less sensitive to outliers than the mean and more statistically efficient than the median.[22]
Prediction-powered inference
Machine learning predictions can also be used to make intervals narrower. Prediction-powered inference, introduced in 2023 by Anastasios Angelopoulos, Stephen Bates, Clara Fannjiang, Michael I. Jordan and Tijana Zrnic, combines a small labelled dataset with predictions from a machine learning system to produce provably valid confidence intervals for quantities such as means, quantiles and regression coefficients, without assumptions about the model that supplies the predictions. More accurate predictions give smaller intervals.[23]
Continue reading
- Bayesian inferenceBayesian inference is a method of statistical inference in which Bayes' theorem is used to update the probability of a hypothesis as new evidence or data becomes available.Listed in See also
- Model EvaluationModel evaluation is the process of measuring how well a machine learning model performs on data it was not trained on, in order to estimate how it will generalize to new, unseen inputs.Listed in See also
- LLM EvaluationLLM evaluation is the practice of measuring what a large language model can do, how reliably it does it, and how it behaves under adversarial or high-stakes conditions.Listed in See also
- Matthews Correlation CoefficientThe Matthews correlation coefficient (MCC) is a single-number measure of the quality of a binary classification, computed from all four cells of the confusion matrix: true positives, true negatives, false…Listed in See also
- Benchmark (AI)In artificial intelligence and machine learning, a benchmark is a specified evaluation used to compare systems under common conditions.Mentioned 13 times above
- Machine LearningMachine learning (ML) is a branch of artificial intelligence that gives computers the ability to learn from data and improve their performance on tasks without being explicitly programmed.Mentioned 6 times above
More to read
References
- ^1 ^2 ^3 ^4 ^5 ^6Greenland, S., Senn, S. J., Rothman, K. J., Carlin, J. B., Poole, C., Goodman, S. N., Altman, D. G. "Statistical tests, P values, confidence intervals, and power: a guide to misinterpretations". European Journal of Epidemiology 31(4):337-350, April 2016. pmc.ncbi.nlm.nih.gov/...PMC4877414
- ^1 ^2 ^3 ^4 ^5 ^6NIST/SEMATECH. "1.3.5.2. Confidence Limits for the Mean". e-Handbook of Statistical Methods. itl.nist.gov/...eda352
- ^1 ^2 ^3 ^4 ^5 ^6 ^7 ^8NIST/SEMATECH. "7.2.4.1. Confidence intervals". e-Handbook of Statistical Methods. itl.nist.gov/...prc241
- ^1 ^2 ^3 ^4 ^5Brown, L. D., Cai, T. T., DasGupta, A. "Interval Estimation for a Binomial Proportion". Statistical Science 16(2):101-133, 2001. doi.org/...1009213286
- ^1 ^2 ^3 ^4 ^5statsmodels developers. "statsmodels.stats.proportion.proportion_confint". statsmodels documentation. statsmodels.org/...s.proportion.proportion_confint
- ^Clopper, C. J., Pearson, E. S. "The Use of Confidence or Fiducial Limits Illustrated in the Case of the Binomial". Biometrika 26(4):404-413, 1934. doi.org/...26.4.404
- ^Efron, B. "Bootstrap Methods: Another Look at the Jackknife". The Annals of Statistics 7(1):1-26, 1979. doi.org/...1176344552
- ^SciPy developers. "scipy.stats.bootstrap". SciPy documentation. docs.scipy.org/...scipy.stats.bootstrap
- ^1 ^2 ^3 ^4 ^5Shafer, G. "On the nineteenth-century origins of significance testing and p-hacking". arXiv:2610.06233, October 2026. arxiv.org/...2610.06233
- ^Neyman, J. "Outline of a Theory of Statistical Estimation Based on the Classical Theory of Probability". Philosophical Transactions of the Royal Society of London. Series A, Mathematical and Physical Sciences 236(767):333-380, 1937. doi.org/...rsta.1937.0005
- ^Hoekstra, R., Morey, R. D., Rouder, J. N., Wagenmakers, E.-J. "Robust misinterpretation of confidence intervals". Psychonomic Bulletin & Review 21(5):1157-1164, 2014. research.rug.nl/...97d-c103-44c5-bb9d-3dccb9b102b7
- ^Morey, R. D., Hoekstra, R., Rouder, J. N., Lee, M. D., Wagenmakers, E.-J. "The fallacy of placing confidence in confidence intervals". Psychonomic Bulletin & Review 23(1):103-123, 2016. doi.org/...s13423-015-0947-8
- ^1 ^2 ^3 ^4 ^5 ^6Miller, E. "Adding Error Bars to Evals: A Statistical Approach to Language Model Evaluations". arXiv:2411.00640, November 2024. arxiv.org/...2411.00640
- ^1 ^2Anthropic. "A statistical approach to model evaluations". Anthropic, 2024-11-19. anthropic.com/...statistical-approach-to-model-evals
- ^1 ^2Llama Team, AI @ Meta. "The Llama 3 Herd of Models". arXiv:2407.21783, 2024. arxiv.org/...2407.21783
- ^Madaan, L., Singh, A. K., Schaeffer, R., Poulton, A., Koyejo, S., Stenetorp, P., Narang, S., Hupkes, D. "Quantifying Variance in Evaluation Benchmarks". arXiv:2406.10229, June 2024. arxiv.org/...2406.10229
- ^Bouthillier, X., Delaunay, P., Bronzi, M., et al. "Accounting for Variance in Machine Learning Benchmarks". arXiv:2103.03098, March 2021. arxiv.org/...2103.03098
- ^1 ^2 ^3Bowyer, S., Aitchison, L., Ivanova, D. R. "Position: Don't Use the CLT in LLM Evals With Fewer Than a Few Hundred Datapoints". arXiv:2503.01747 (ICML 2025 spotlight position paper), 2025. arxiv.org/...2503.01747
- ^Koehn, P. "Statistical Significance Tests for Machine Translation Evaluation". Proceedings of the 2004 Conference on Empirical Methods in Natural Language Processing, pp. 388-395, July 2004. aclanthology.org/W04-3250
- ^1 ^2 ^3Chiang, W.-L., Zheng, L., Sheng, Y., Angelopoulos, A. N., Li, T., Li, D., Zhang, H., Zhu, B., Jordan, M., Gonzalez, J. E., Stoica, I. "Chatbot Arena: An Open Platform for Evaluating LLMs by Human Preference". arXiv:2403.04132, March 2024. arxiv.org/...2403.04132
- ^1 ^2Agarwal, R., Schwarzer, M., Castro, P. S., Courville, A., Bellemare, M. G. "Deep Reinforcement Learning at the Edge of the Statistical Precipice". arXiv:2108.13264 (NeurIPS 2021), 2021. arxiv.org/...2108.13264
- ^Google Research. "rliable". GitHub. github.com/...rliable
- ^Angelopoulos, A. N., Bates, S., Fannjiang, C., Jordan, M. I., Zrnic, T. "Prediction-Powered Inference". arXiv:2301.09633, January 2023. arxiv.org/...2301.09633
- ^Wilson, E. B. "Probable Inference, the Law of Succession, and Statistical Inference". Journal of the American Statistical Association 22(158):209-212, 1927. doi.org/...01621459.1927.10502953
Improve this article
Add missing citations, update stale details, or write a clearer explanation. Anyone can edit: changes go live when you publish, and every edit is checked by an editor.
2 revisions · v2 · 3,492 words · full history
Fact-checks are independent of edits: a reviewer re-verifies the article against its sources and stamps the date. How we verify
Research and drafting on this wiki are AI-assisted, under named human editorial standards. How AI is used here
Reviewer note: Independent fact-check before publication on November 18, 2026: 78 claims checked against 24 cited and independent sources; 0 material and 5 minor corrections applied before publication.
Cite this page: AI Wiki. "Confidence interval." aiwiki.ai, updated 18 Nov 2026, fact-checked 18 Nov 2026. CC BY 4.0. https://aiwiki.ai/wiki/confidence_interval